vega@polarvega.com
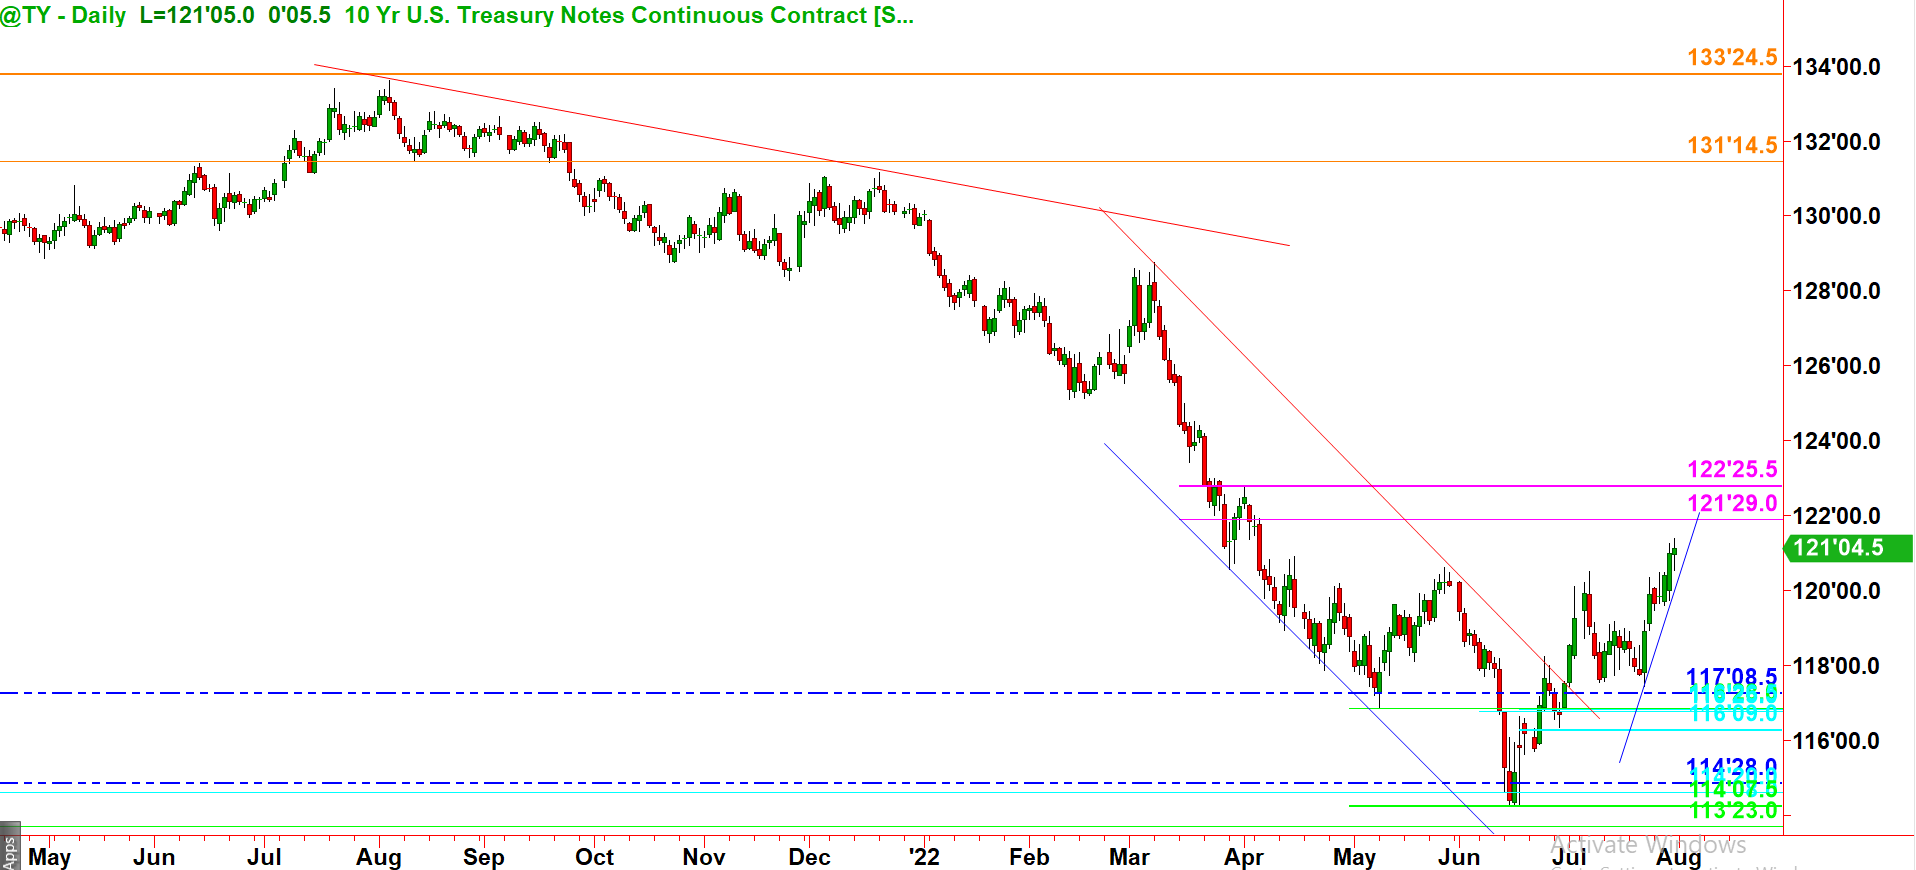
The US Treasury 10 years bond has established a new high and is now in an Uptrend on the Daily Chart. One now needs for it to trace back into a Daily buyers' area and take a LONG position.
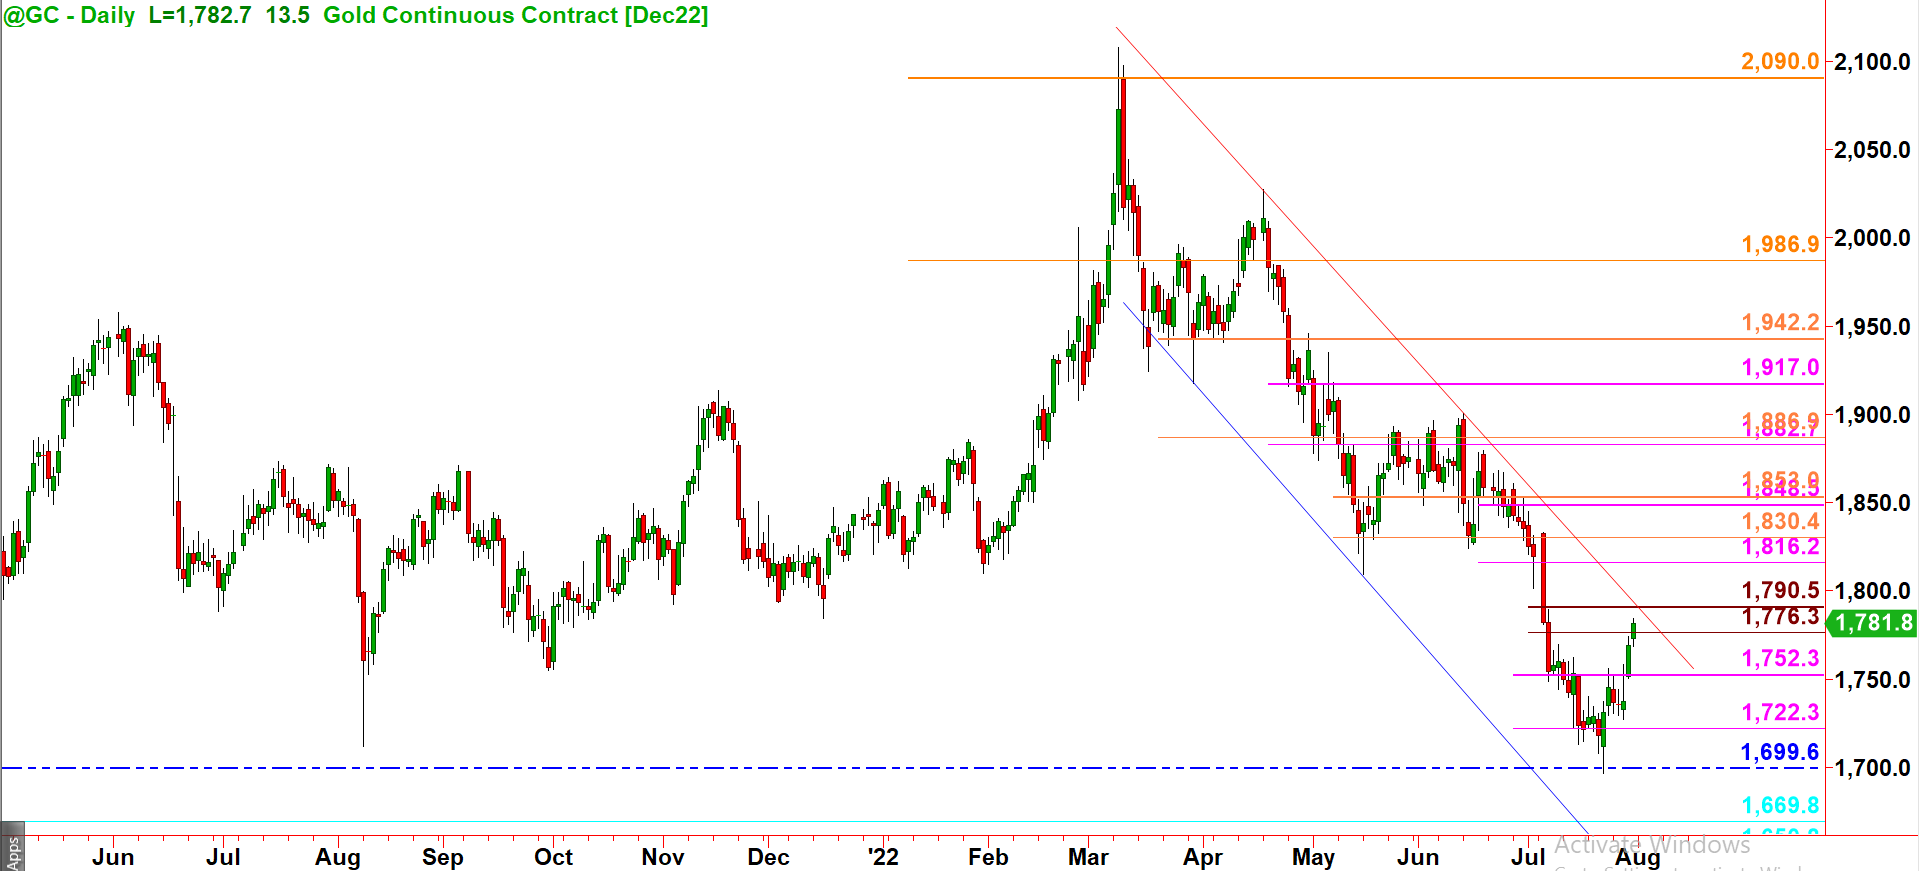
GOLD like Silver has broken out of A SELLERS's area on the Daily chart and is now at a higher SELLERS' area on the 240 minute Chart. If it retraces a bit and makes a higher low, the temporary uptrend on the Daily Chart shall re-establish itself.
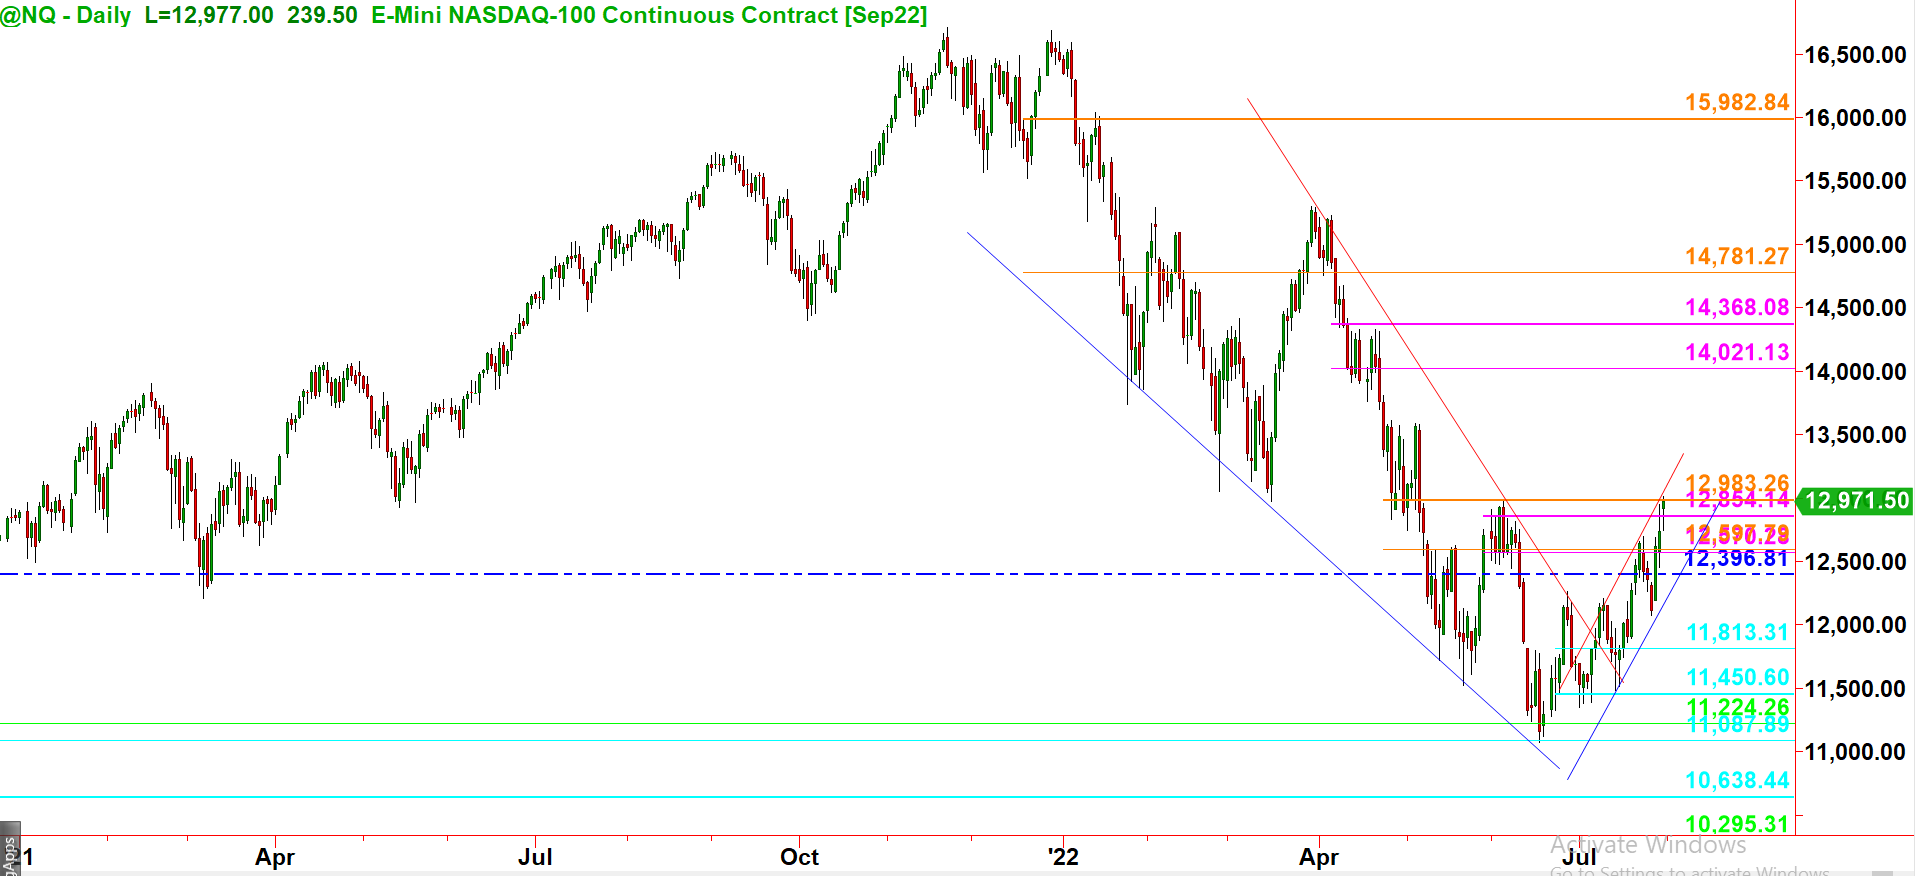
NQ has been the most aggressive amongst the Indexes in the last three years. It led the recovery after Covid crash and now it's leading the correction during the Post Covid period. It showed a bounce from the 11080 area which provided a strong support during the Covid recovery period. NQ unlike the other Indexes has been very strong has nearly come out of a WEEKLY SELLERS' area on the back of weak Dollar last week.If NQ manages to print one or two Green candles on the Daily Chart we may call it to be in an Uptrend on the Weekly time frame.
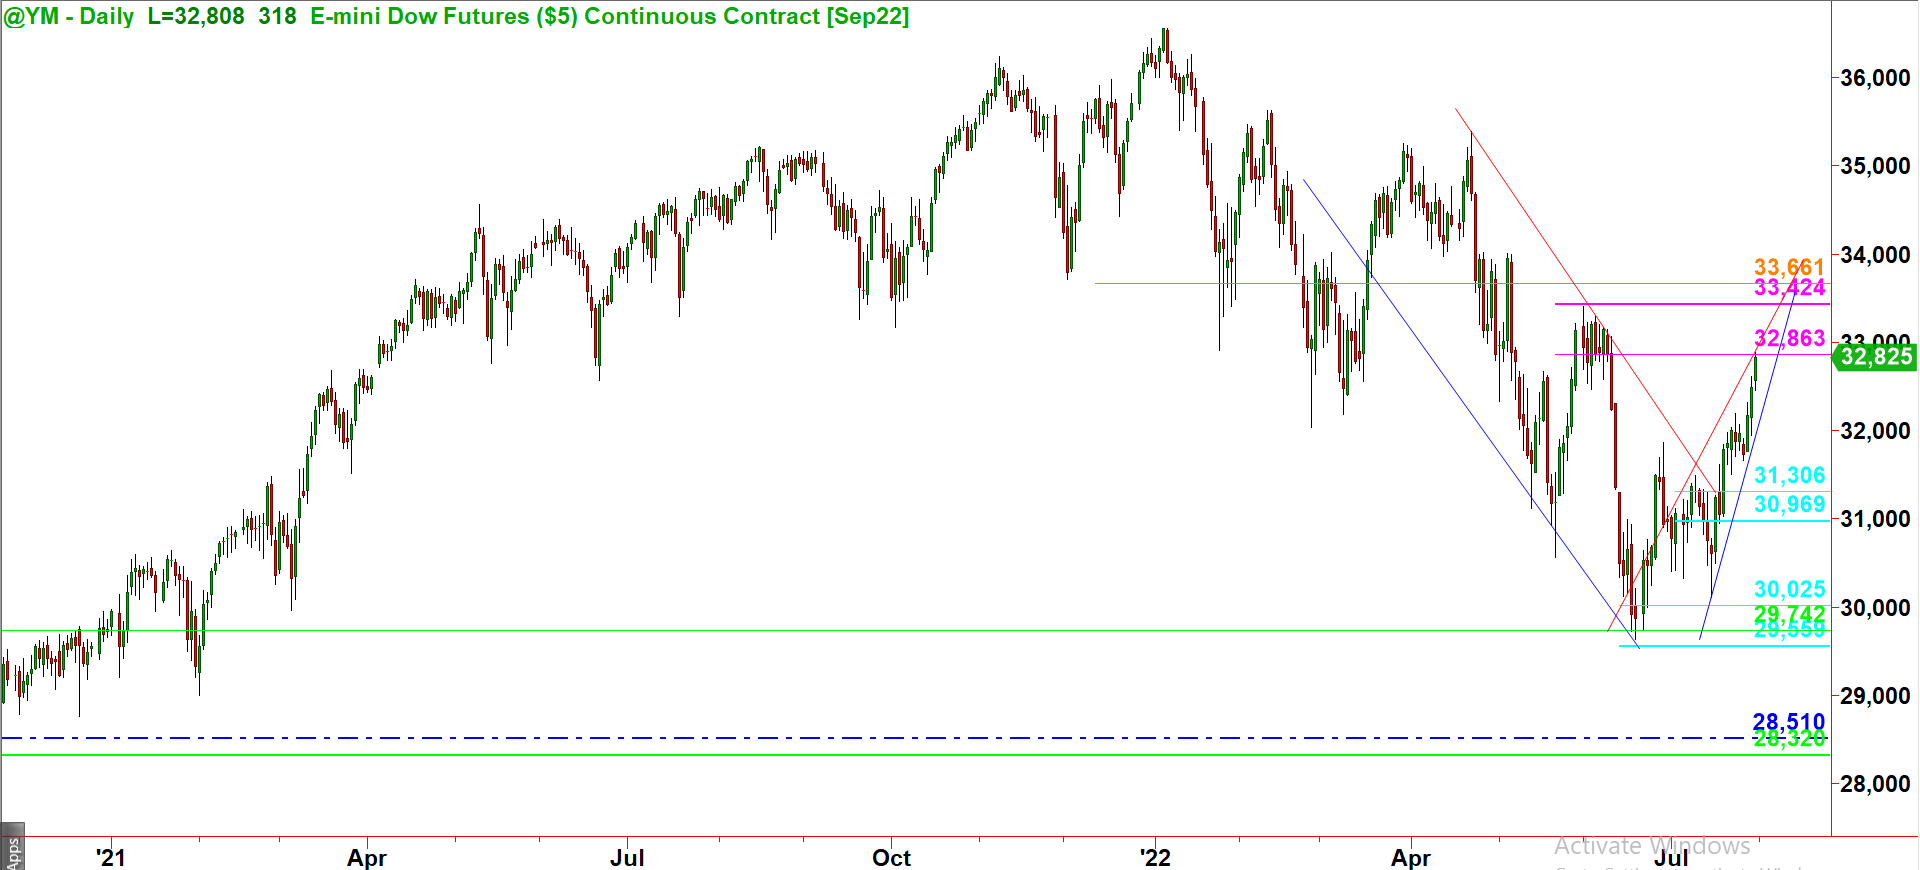
YM like all other Equities has established a Higher low and a higher HIGH on the Daily time frame.and like the other Indexes it's it has shown excellent strength at the back of a USD weakness last week. It's currently at a WEEKLY SELLERS' area so one needs to be careful before taking Longs on lower time frames.
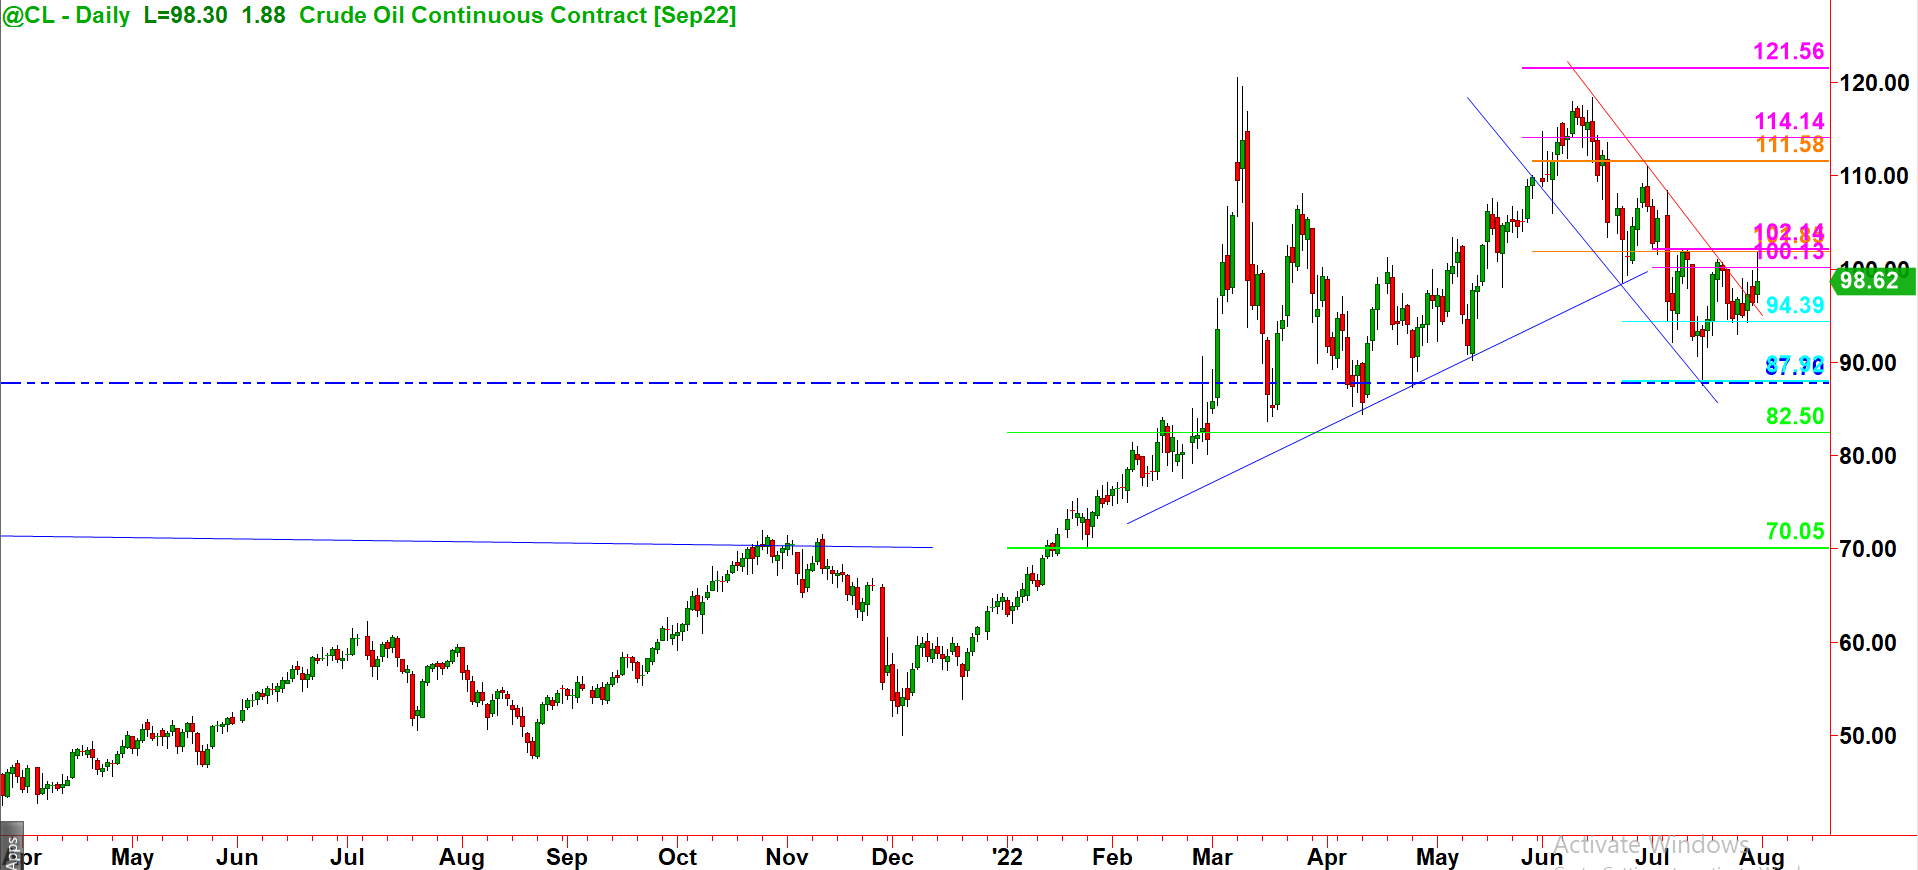
Oil has been trading within 95 and 102 in spie of a Week Dollar as it's more under the effect of the World political situation similar to Natural gas. Therefore, one needs to be fully aware of the news and the envirionment while placing a trade.
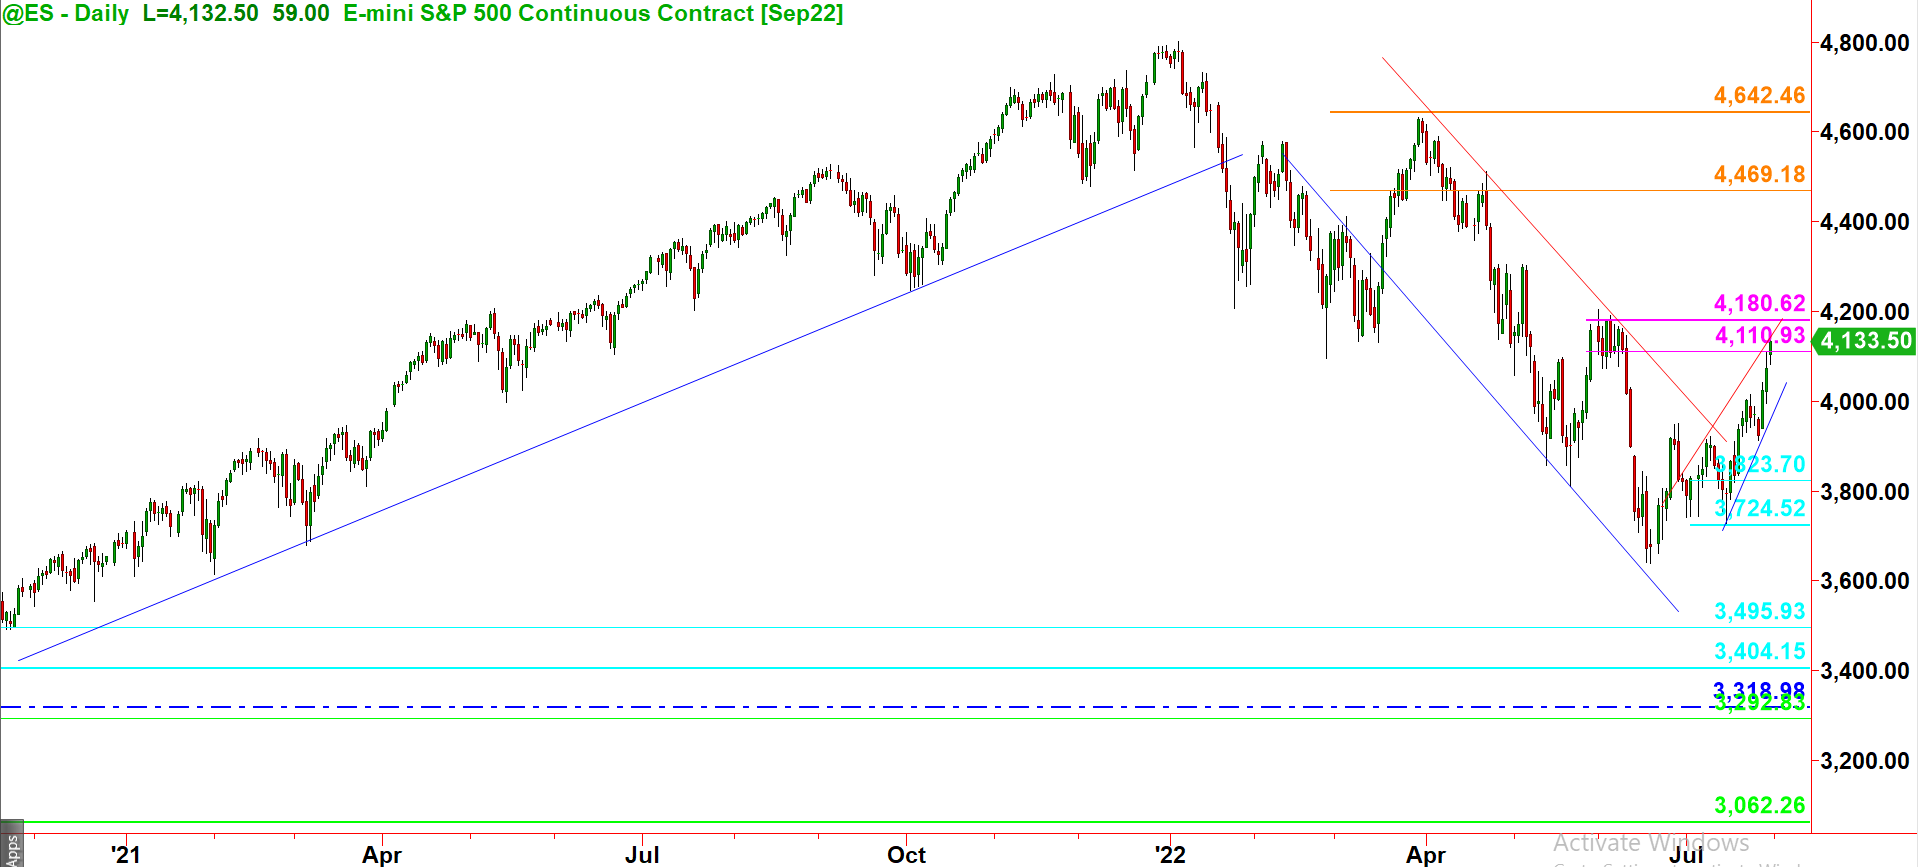
ES after making a HIGHER LOW has made a HIGHER HIGH on the Daily Chart and is currently in a Weekly SELLERS' area. With the USD Index in a WEEKLY BUYERS' area we can expect it to bounce back after losing its inertia from last week and that may lead the ESU to retrace into a Buyer's area while the USD Index traces back into a SELLERS' area. So one needs to be careful before going long on smaller time frames.
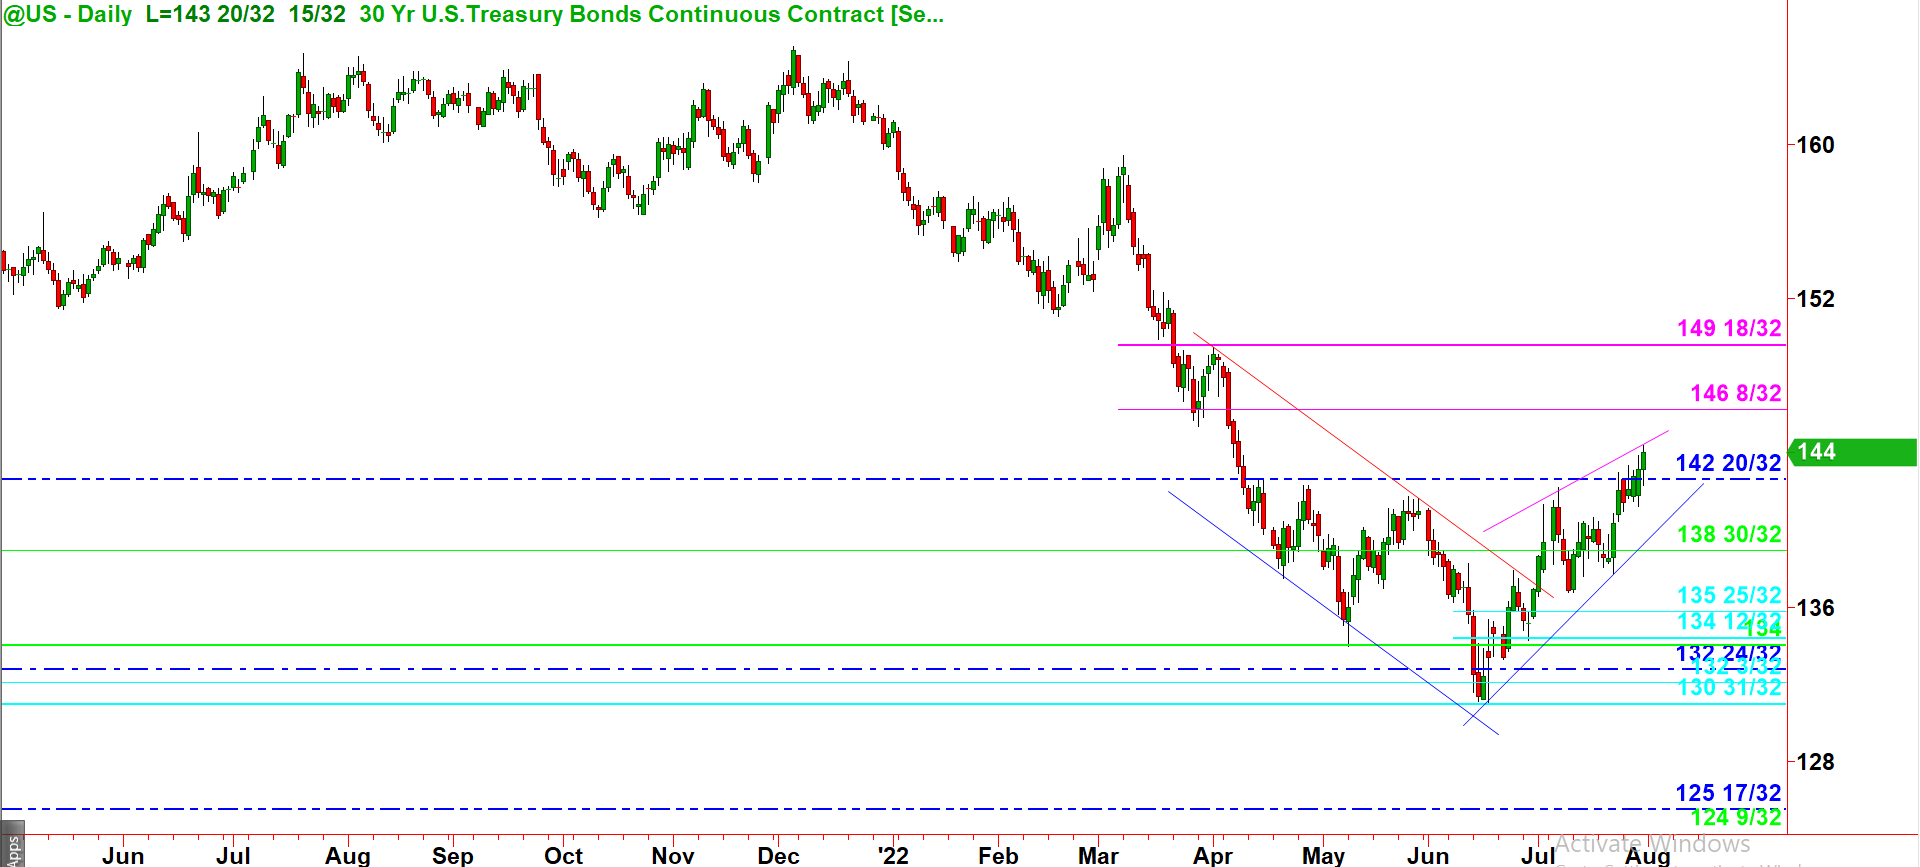
The US Treasury bond had been trading SIDEWAYS until it managed to break out last week and close at 144 this week. One needs to see the movement of USD Index this week and wait for it retrace into the buyers's zone around 142 to take a LONG Trade.
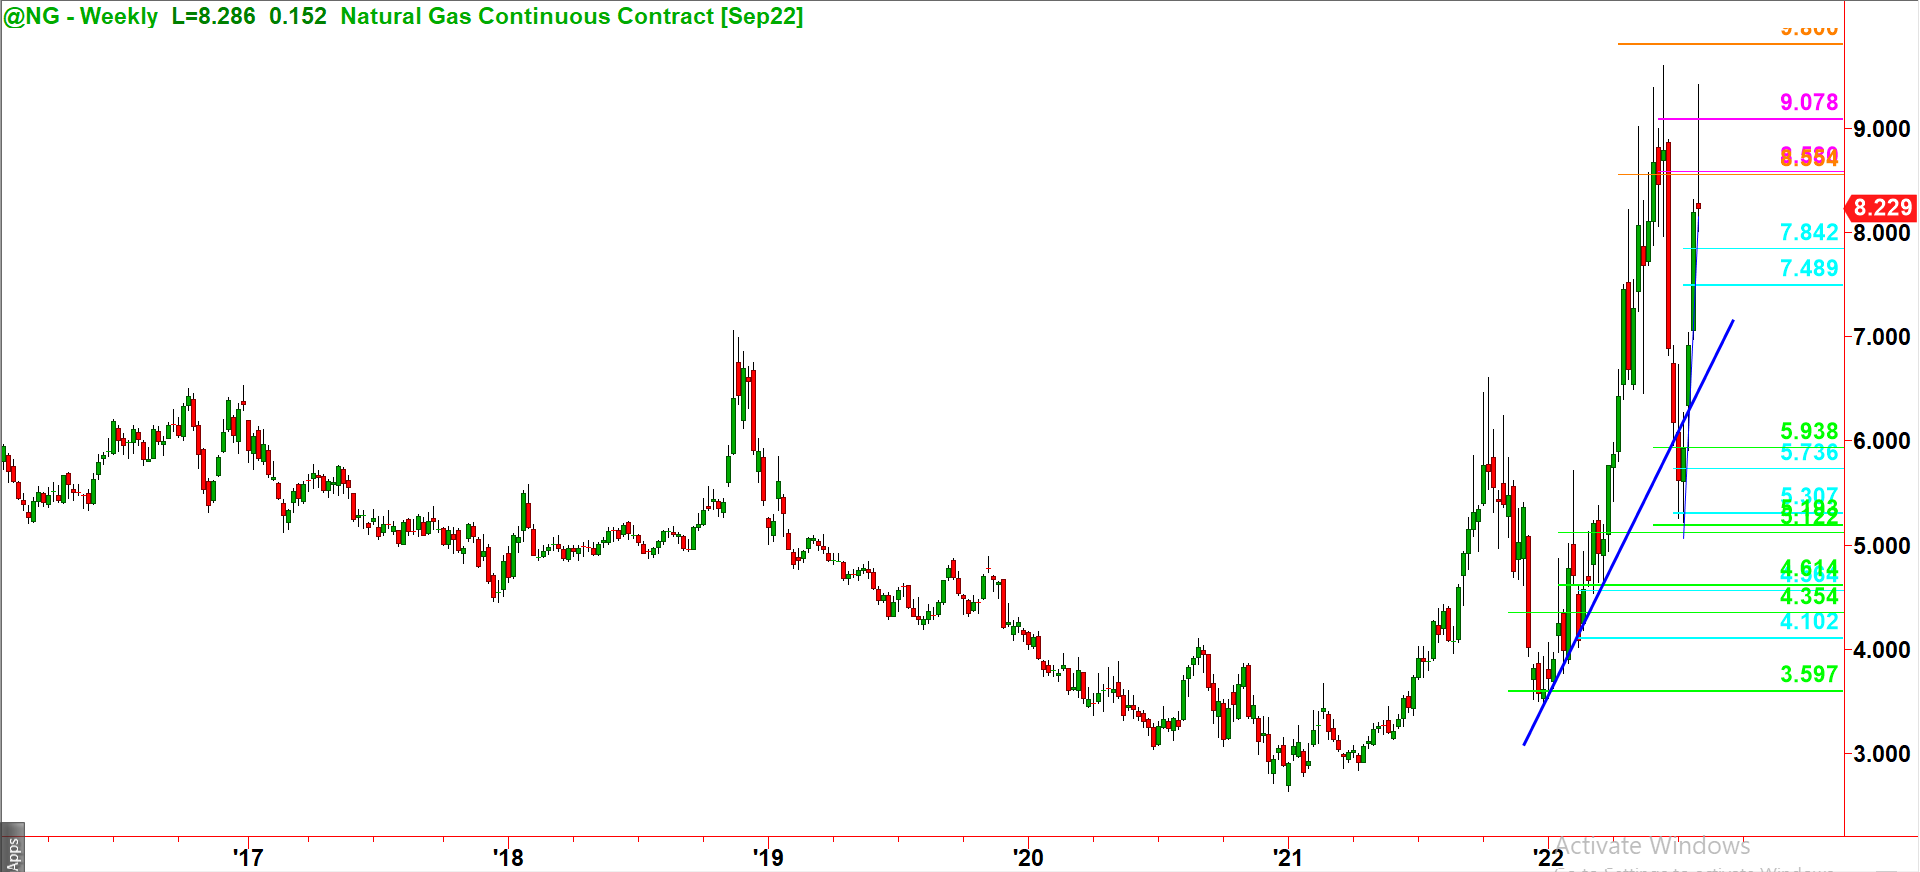
Natural Gas has reversed this week after nearly touching it's previous high at 9.6. The Natural gas is moving under the effect of the supply being cut off by Russia and one needs to wait and watch for the prices to stabilise.
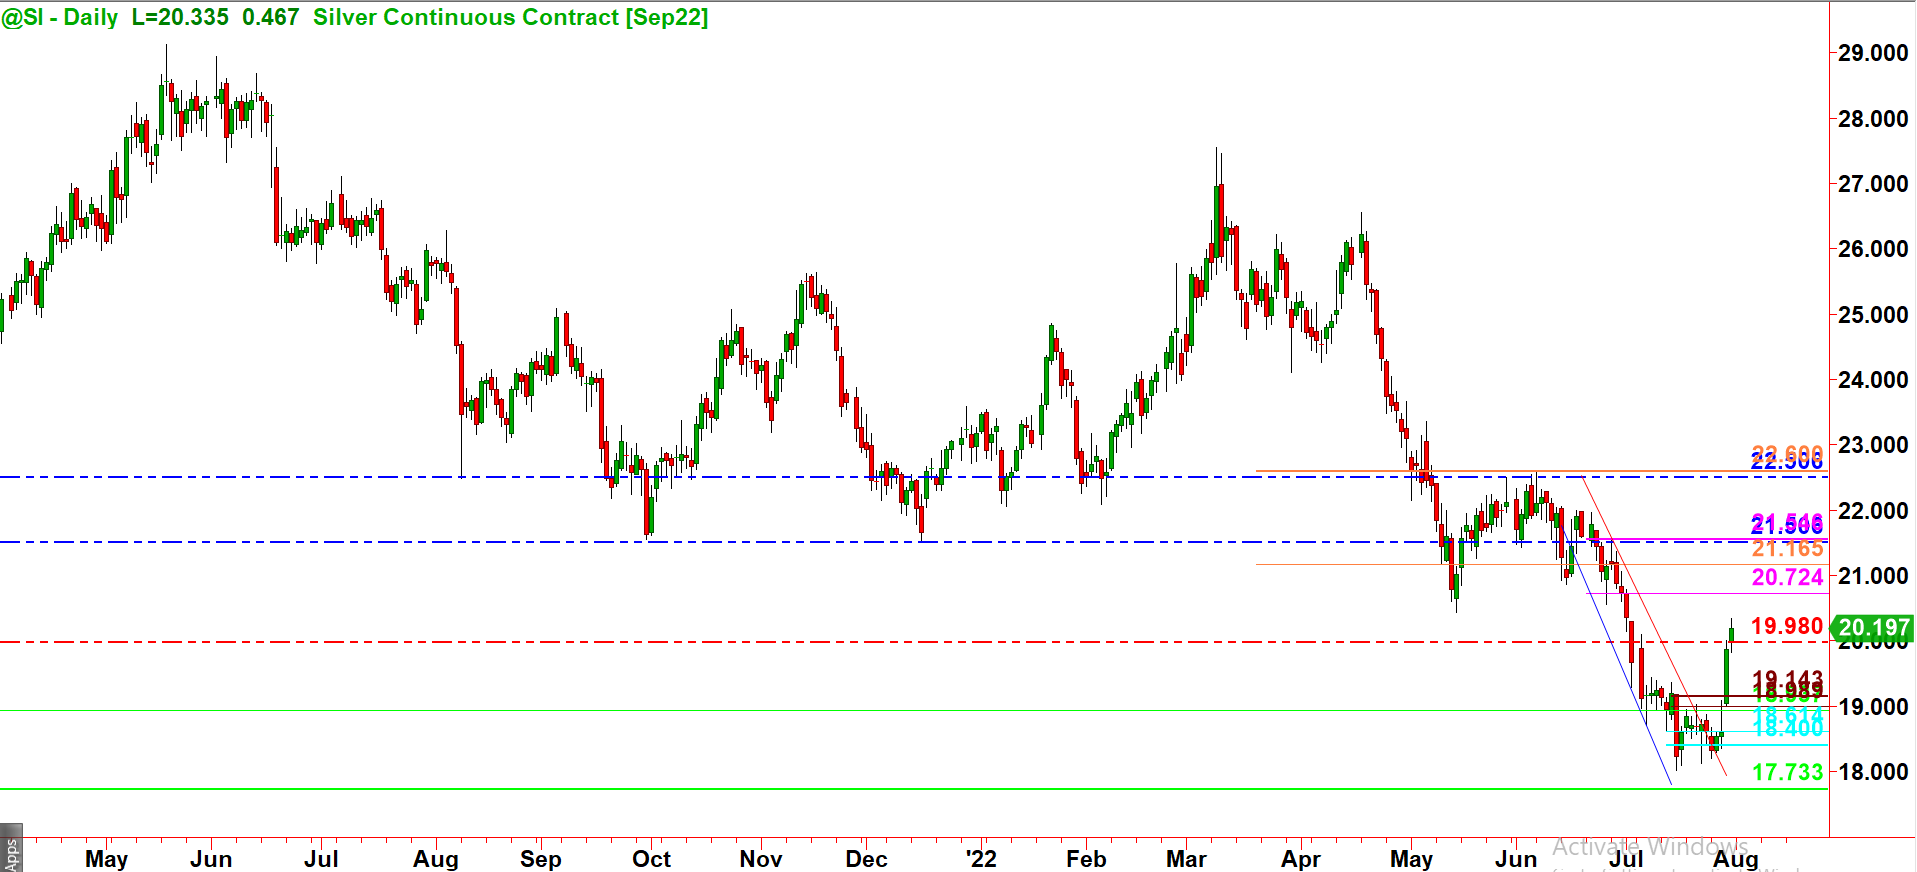
Silver has been the stronngest ogf all the metals and has established a 'HIGH' after breaking out of the SELLERS' area at 19.00 with an explosive GREEN candle. It may trace back a bit if USD INDEX tries to recover this week.
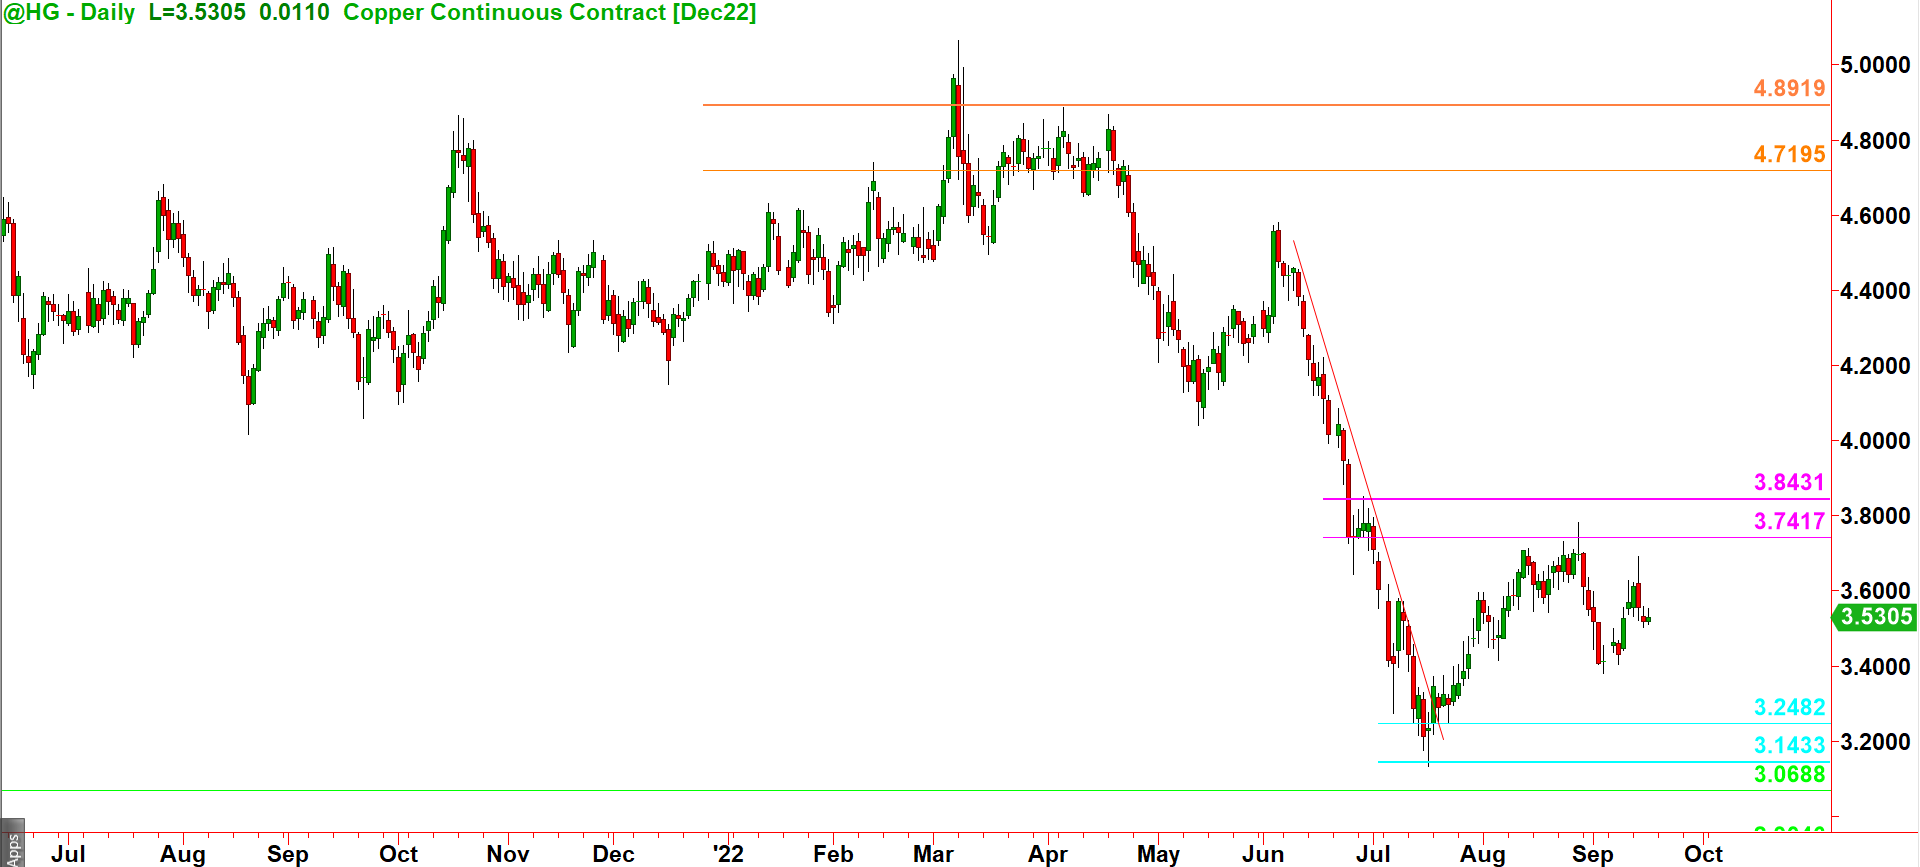
Copper seems to have bottomed out and has created a higher low and a higher high on the Daily time frame. It needs to clear out the Sellers' area be`tween 3.7 and 3.9 to continue and confirm the Uptrend.